

Most fleet technology partners can show you a badge from a third-party ranking. Make sure you’re looking for a pattern of consistent performance, season over season and year over year.
If you’re building a shortlist of fleet technology partners, you’ll see a lot of No. 1 claims. G2 alone publishes separate reports for fleet management, fleet tracking, asset tracking, and more, split by company size and report type. In a single quarter, several competitors can make similar-looking claims and all be truthful based on different reports.
All of this makes any one ranking less useful on its own than in context. A position and pattern established across many seasons, confirmed on other review sites, and backed up by strong customer evidence tells you more about the customer experience.
Compare like with like: the same report type, company-size segment, and measurement.
What do G2 and TrustRadius rankings measure?
Each G2 report type measures something different. There are three elements of the G2 scoring methodology that determine how you should evaluate rankings.
First, G2 publishes multiple report types, and each takes a different angle on the data:
- G2’s Grid reports plot each product on two scores: satisfaction, drawn from review questions about ease of use, quality of support, and likelihood to recommend; and market presence, drawn from review volume and third-party data like employee counts and web traffic.
- G2’s Momentum Grid measures growth and traction, favoring products with large year-over-year change in employee count, review volume, social following, and web presence.
- G2 Implementation Index reports evaluate “time to go live,” ease of setup, how the product was implemented, and share of user adoption.
- G2 Results Index reports use whether the product meets requirements, user adoption, estimated ROI, and likelihood to recommend.
- G2 Relationship Index reports measure ease of doing business, quality of support, and likelihood to recommend.
The second element is company size. G2’s enterprise, mid-market, and small-business reports segment reviewers by size of the company they work for: 1,001+ for enterprise, 51 to 1,000 for mid-market, and 50 or fewer for small business. These segments reflect headcount, so how well those map to fleet sizes will depend on the provider.
Third, G2 normalizes its scores from 0 to 100 against the other products in the same category. A satisfaction score of 99 describes how a product compares to competitors within its own category, for instance.
TrustRadius, a B2B review site, awards Buyers Choice based on customer feedback across capabilities, value, and customer relationships.
Reading the right report correctly and looking for trends matters. A vendor that leads in a small-business report may trail in an enterprise one, and a strong Momentum ranking over time reflects sustained traction rather than just a moment in time.
Where has Motive consistently ranked?
Motive consistently ranks atop G2’s Momentum Grid for fleet management and at the top of TrustRadius for fleet management, across multiple consecutive periods.
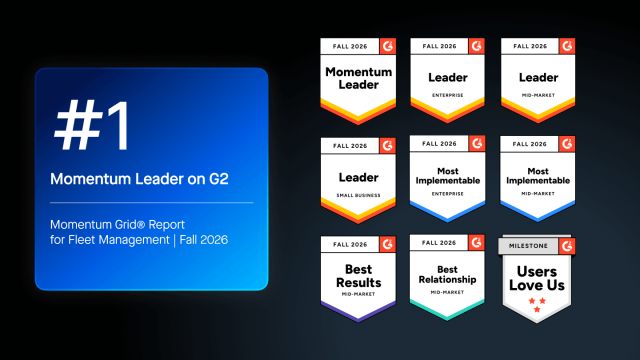
Motive ranked No. 1 on G2’s Fleet Management Momentum Grid for the ninth consecutive quarter as of the Fall 2026 rankings, with a Momentum score of 90 against Samsara’s 84. Because the Momentum Grid combines review data with social, web, and employee signals, a long run at the top reflects sustained traction and perceived growth.
Other current G2 results come from across the different report types:
- Three No. 1 rankings in Momentum Grid reports (Trucking, Fleet Management, and Fleet Tracking). Motive topped the Momentum Grid in each of those categories across multiple consecutive quarters, reflecting enduring momentum in those areas.
- Three No. 1 rankings on Implementation Index reports (Fleet Management, Fleet Tracking, and mid-market Asset Tracking) reflecting customers’ high ratings of “time to go live,” “ease of setup,” and share of user adoption.
- A 99% satisfaction score on G2’s 0 to 100 scale in Fleet Management.
TrustRadius, a separate review site with its own awards, points the same way. Motive has ranked No. 1 for fleet management on TrustRadius for four consecutive years, and in 2026 earned both its Buyers Choice and Top Rated awards.
How quickly do Motive customers report seeing value and return on investment?
Motive’s customers see value and return in months.
In G2’s Winter 2026 Enterprise Grid Report for Fleet Management, Motive customers reported an average estimated payback of 5 months, against 11 months for Samsara and 17 months for Lytx.
This continued a pattern from the prior year. In G2’s Winter 2025 Fleet Management reports, Motive customers said they recovered their initial investment within six months on average, 40% faster than Samsara customers and nearly 65% faster than Lytx customers. Motive’s satisfaction scores in those reports were also higher than Verizon Connect’s in both the enterprise and mid-market segments.
And in the most recent reports, the trend of fast return on investment and time-to-value continued. In G2’s Summer 2026 Enterprise Results Index for Asset Tracking, Motive customers reported an estimated ROI of 3.55 months, against 8.85 months for Samsara and an 11.41-month category average. And in the Fall 2026 Enterprise Results Index for Fleet Management, Motive customers reached ROI in 5.7 months, against 9.44 months for Samsara, about 40% faster.
Go-live times tell the same story. The Winter 2026 Enterprise Grid Report put enterprise Fleet Management go-live at 2.6 months for Motive, against 3.6 months for Samsara and 4.2 months for Lytx. By Summer 2026, G2’s Implementation Index had enterprise Fleet Management customers going live in 2.52 months on average, against 3.34 months for Samsara, and enterprise Asset Tracking customers going live in 1.84 months, against 3.12 months for Samsara and a 3.53-month category average. In Fall 2026, Motive ranked #1 on G2’s Implementation Index for Fleet Tracking, where customers reported going live in 1.67 months with a 90% ease-of-setup score.
Reviewers tend to describe that timeline in plain terms. “If the current trend holds true, we have paid for the three-year commitment in less than 6 months,” one safety manager wrote on G2, describing a 50% drop in slow-speed, fixed-object collisions within the first few months.
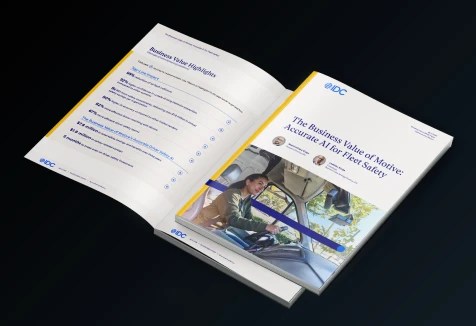
The timeline holds up outside G2, too. When analyst firm IDC studied six organizations using Motive’s AI-powered safety tools, it found a five-month payback on their safety investment, the same span G2’s Winter 2026 enterprise reviewers reported. Those organizations also reported more than 8x return on that investment and over $1.8 million in annual safety savings on average.
What do customer results show behind the rankings?
The same strengths from the independent review sites turn up in Motive’s published customer stories: how quickly customers deploy, how the working relationship holds up, and what the platform returns.
Implementation is the clearest example. EnerCorp’s in-house mechanics installed AI Dashcams in all 220 vehicles in 90 days. At All Chemical Transport, COO Anthony Coruccini reports installation taking about 20 minutes per truck, done in-house, saving $52,000 in installation costs and at least 180 hours. Reviewers describe the relationship in similar terms. “Motive had a wonderful team on our account and made things very easy,” one asset and fleet manager wrote in a G2 review Motive shared. “In fact all three of our Motive teams were incredible — sales, implementation, account manager.”
The returns are just as specific. At Ernst Concrete, Director of Risk and Safety Paul Fly reported about $1.3 million saved annually in direct losses, and about $6.5 million once downtime, injured employees, and legal expenses are counted, which he calculated as a 2,000% return. Smart Chemical Solutions received $486.90 in discounts on $3.4 million of spend with its previous card provider in 2022, and now averages a monthly rebate of $4,879. And FusionSite Services went from 76 claims in a single year, when it ran 479 vehicles, to one claim year to date across more than 1,000 vehicles.
See what customers say, in their own words.
Read Motive’s reviews on G2 and TrustRadius, or see what 351 organizations reported in the 2026 Motive ROI Report.
Methodology note:
G2 rankings and scores reflect the report type and season named in each case: G2’s Winter 2025 reports; the Winter 2026 Enterprise Grid Report and Grid Report for Fleet Management; and the Summer 2026 and Fall 2026 Momentum Grid, Implementation Index, Relationship Index, and Results Index reports. G2’s Momentum Grid combines review data with social, web, and employee data. Its Grid and index reports draw on reviews from verified users. TrustRadius results reflect its 2026 Buyers Choice and Top Rated awards. Reviews are public on G2 and TrustRadius; individual experiences vary. IDC findings come from the IDC White Paper sponsored by Motive Technologies, Inc., “The Business Value of Motive’s Accurate AI for Fleet Safety,” Doc #US54413826-BVWP, May 2026, based on interviews with six organizations.