


Background
Road safety remains a critical challenge for the organizations and frontline workers who keep the physical economy and our communities running – those who stock our shelves, heat our homes, deliver essential goods, and maintain public infrastructure and safety. Across industries and the public sector alike, these teams share one thing in common: they rely on commercial vehicles to do their jobs and serve the communities that depend on them every day.
To better understand how collision patterns evolved over the past year – and where risk is headed – Motive analyzed data from commercial drivers using the Motive AI Dashcam across the United States, Mexico, and Canada.
This analysis focuses on AI-detected safety events captured in 1.2 billion hours of video to identify when, where, and why collisions occurred from 2024 to 2025. All statements included in the report are based on data captured by Motive’s platform and analyzed by our data science team, offering a data-driven look at how road safety risks shifted in 2025, what organizations can expect in 2026, and why this year represents a turning point in how collisions are prevented.
Data methodology
The 2026 Motive AI Road Safety Report is based on aggregated, anonymized insights from the Motive platform covering October 2024 through October 2025, with select analyses extending through December 2025. The report also incorporates publicly available data from the Federal Motor Carrier Safety Administration (FMCSA), the U.S. Census Bureau, and the U.S. Department of Transportation (USDOT).
Top Findings
- Collisions are increasingly preventable. For every one collision, organizations now see seven near-collisions—early warning signals that allow intervention before damage occurs.
- Preliminary data shows 2025 saw fewer road fatalities, but risk remains uneven and highly concentrated by time of day, season, and operating environment.
- Late-night driving is more dangerous than rush hour. Collision risk peaks at 3 a.m., when it triples compared to midday.
- Behavior—not road conditions or mileage—is the dominant driver of collision risk. Drowsiness, distraction, and aggressive driving consistently precede incidents.
- Transportation and logistics fleets drive the most miles but have the lowest overall collision rates, demonstrating that the operating environment matters more than distance traveled.
- Cell phone use is among the top five risky behaviors linked to collisions, with use peaking in late afternoons. Drivers in agriculture show the highest rates of cell phone use.
- Smoking behind the wheel happens almost 4,000 times a day, emerging as a major and often underestimated source of distraction.
- Even as 2025 tariff changes increased trade activity and congestion around ports and border crossings, collision rates in those areas remained stable, suggesting risk often shifts inland rather than concentrating at ports.
Top Predictions
- 2026 will mark a tipping point where AI-powered, real-time intervention—not post-incident analysis—becomes the primary driver of collision reduction. Collision rates will still peak in Q1 due to winter weather and shorter daylight, but overall risk will continue to decline as unsafe behaviors are addressed earlier.
- Driver behavior will remain the biggest safety risk. Drowsiness, cell phone use, and smoking will continue to outweigh road conditions as predictors of collisions.
- Near-collisions will become the most important leading safety indicator, replacing collisions as the primary metric organizations use to manage risk.
- Ongoing geopolitical and trade volatility will continue to shift freight patterns, pushing risk inland and into overnight corridors rather than causing nationwide spikes.
- Industry-level safety gaps will widen. Agriculture, waste & recycling, and field services will see the biggest AI-driven safety gains as high-risk industries adopt more tailored, behavior-based safety programs.
- One-size-fits-all safety programs will continue to underperform. Organizations will increasingly demand AI tailored to their routes, schedules, geographies, and operating environments.
- Where and when drivers operate will matter more than how far they travel. Geography, congestion, weather, and job type will outweigh mileage as predictors of collision risk.
Traffic fatalities declined in 2025, but road risk remains
Early estimates show road safety meaningfully improved in 2025 with fewer severe collisions on the road, exactly the kind of progress AI-powered prevention is meant to drive. Severe collisions involving injuries, tow-aways and fatalities are trending 9.5% lower, with reported injuries trending 7.7% down year-over-year and focused on long-haul, heavy-duty interstate fleets that move goods nationwide. These data points concentrate mainly on the long-haul, heavy-duty transportation space, involving vehicles that see some of the greatest risk on the road due to weight and cargo.
This is also in line with what the National Highway Traffic Safety Administration (NHTSA) reported in September showing an 8.2% decrease in traffic fatalities in the first half of 2025 compared to the same period in 2024, the largest mid-year decline in more than a decade, even as Americans drove more than 12.1 billion more miles.
Our data suggests that what has changed isn’t driver behavior – it’s visibility. The decline signals that more organizations are identifying and addressing risk earlier, before collisions happen. Increased adoption of AI-powered Driver Safety products, which can detect risky behaviors and alert drivers and managers in real time, are increasingly shaping outcomes rather than simply capturing them.
That progress, however, has not been evenly distributed across the country, and risk remains high overall.
Collision trends vary widely by state
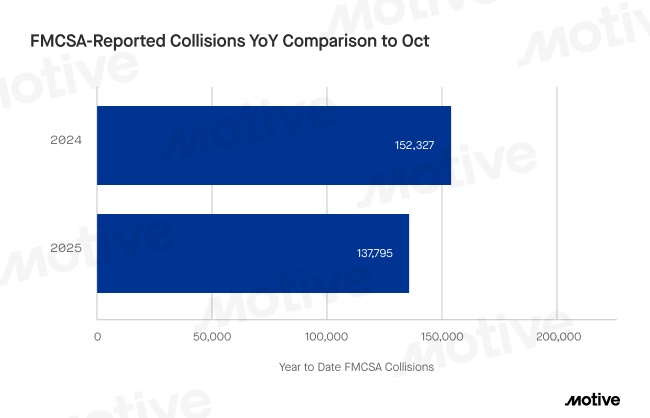
At the national level, year-over-year collision trends varied by state, reflecting differences in operating environments, enforcement, and traffic patterns (based on federally reported collision data available through October 2025, reviewed by Motive in December 2025). However, changes were not uniform in scale or severity, particularly in smaller states where lower overall vehicle volumes can make percentage changes appear more pronounced.
Several larger, higher-volume states saw notable year-over-year declines in collisions, including:
- Florida: 42.6% reduction
- North Carolina: 29.8% reduction
- New Jersey: 24.8% reduction
These states represent larger, higher-volume freight corridors, suggesting that improvements in safety practices and earlier risk detection can have a meaningful impact at scale.
Some smaller states experienced year-over-year increases in reported collisions, including:
- Rhode Island: 24.8% increase
- Montana: 13.5% increase
- Maine: 11.3% increase
Importantly, these states also have lower overall vehicle volumes and baseline collision rates, which can amplify year-over-year percentage changes. In Rhode Island, for example, while total collisions increased, no fatal collisions were reported, suggesting that overall severity declined even as incident counts rose.
Taken together, these patterns underscore how local conditions and operating context continue to influence collision outcomes, and why state-level trends are best interpreted alongside volume and severity.
“What’s changed over the last few years isn’t the risks on the road or the demands on drivers — it’s visibility,” said Hamish Woodrow, head of strategic analytics and data engineering at Motive. “If anything, driving is getting harder, with more distraction from cell phones, denser traffic, and tighter delivery pressure. The risk has always been there. What’s different now is that AI allows organizations to see it earlier, coach drivers more consistently, and intervene before unsafe behavior turns into a collision.”“We’ve seen collision rates fall before,” Woodrow added, “but I believe what’s different this time is why they’re falling. This isn’t a temporary traffic lull or a seasonal dip — it reflects sustained changes in how organizations identify, coach, and manage risk.”
Near-collision data shows how AI is helping prevent collisions
The impact of AI-powered safety tools is especially clear when examining near-collisions — dangerous moments that don’t result in a collision, but signal heightened risk. For every one collision, organizations saw seven near-collisions — a pattern that we believe suggests how many warning signals AI can deliver.
What to watch for in 2026
These close calls give organizations visibility into risk before a collision occurs, when there is still time to intervene. Organizations that monitor near-collisions can spot patterns earlier, coach drivers sooner, and reduce risk before it escalates. By contrast, relying only on collision data means reacting after the damage is already done.
“Motive’s dual-facing AI Dashcams have allowed us to approach safety in a much more proactive way,” said Paul Fly, director of risk and safety at Ernst Concrete. “In the past, we looked at lagging indicators and losses. Taking a proactive approach to safety has enabled us to reduce distracted driving and cell phone use by 81% in 13 months.”
Risk hasn’t disappeared — it’s just more visible in driver behavior
While collision rates are trending down, risk remains a daily reality on the road. Motive’s data reveals specific risky behaviors and conditions that contribute to collisions, underscoring the importance of proactive safety strategies that prioritize early detection, not just post-incident response.
Drowsy driving is a leading contributor to collisions
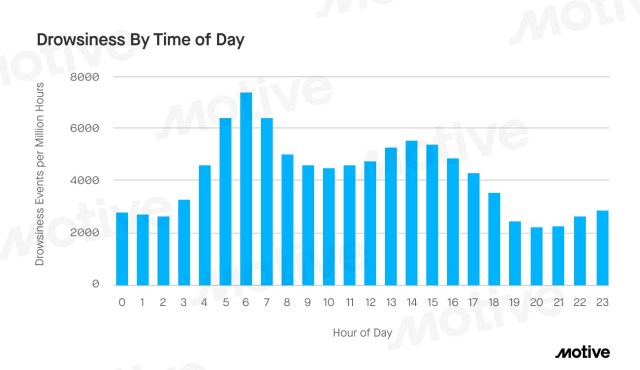
Even as overall collisions decline, risk isn’t spread evenly throughout the day. The most dangerous hours are when drivers are tired, and visibility is low — late at night, early in the morning, and around dusk. We also see a clear early-morning spike, with drowsiness rising sharply between 6 and 7 a.m.
Overnight hours carry the highest chances for collision. Prior to fall, collision risk is highest around 3 a.m., when collision rates are nearly three times higher than they are at midday. Risk also spikes around midnight and 1 a.m., reinforcing how dangerous overnight driving can be.
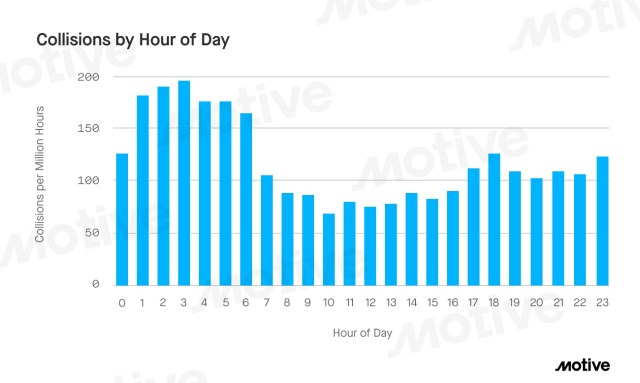
However, dusk has become another high-risk period. More recent data shows another peak at the end of the day: since October, when daylight savings time ends and darkness falls earlier, collisions have been highest around 6 p.m., during dusk, at about 2.4x the midday rate.
Seasonality makes these risks harder to manage. January is especially challenging, with shorter daylight hours, colder weather, and post-holiday drowsiness increasing the risk — particularly for early-morning drivers. As more work continues to shift into off-peak hours, drowsiness is likely to remain one of the most underestimated safety risks.
“Evening and early-morning risk isn’t new. What’s new is how consistently it shows up across regions and industries,” said Woodrow. “Drowsiness has always been a leading indicator of collision risk, but it’s been one of the hardest to quantify until now.”
What to watch for in 2026
These trends reinforce a critical point: Spotting early signs of drowsiness — and intervening before a collision happens — is critical to improving road safety.
Aggressive driving is among the strongest predictors of collisions
Aggressive driving remains one of the most dangerous risk factors on the road. Drivers involved in collisions consistently exhibit significantly higher rates of speeding, hard cornering, and lane swerving than those who avoid collisions. In October 2025 alone, drivers who experienced a collision were 25% more likely to hard corner or swerve lanes and 7% more likely to speed. These patterns reinforce a critical insight: collisions are rarely the result of a single mistake—they are most often preceded by an accumulation of risky behaviors over time.
Unsafe driving trends across the U.S.
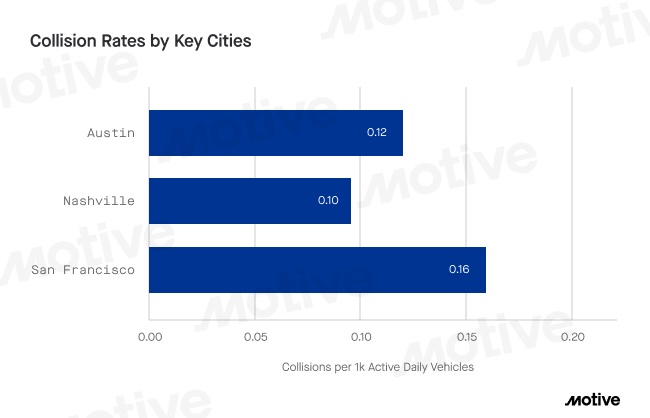
To understand how unsafe driving behaviors differ by location, we analyzed driving data from three major U.S. cities where Motive has offices: San Francisco, Austin, and Nashville. While speeding shows up everywhere, the types of risky behaviors that most often lead to collisions vary meaningfully by city, shaped by local traffic patterns and driving environments.
- Speeding is the number one most common risky behavior in all three cities. Of all unsafe driving behaviors, speeding correlates most strongly with collisions. It remains the baseline safety risk regardless of location.
- Cell phone use is also consistently among the top five risky behaviors in every city, highlighting how widespread distracted driving continues to be across geographies.
City-by-city trends
- Nashville stands out for aggressive highway driving.
- Drivers in Nashville speed at nearly twice the rate of drivers in Austin, making it the city’s top risk factor.
- Close following and unsafe lane changes also rank among Nashville’s top collision-linked behaviors, suggesting risky behaviors often occur together.
- Heavy interstate use, fast-moving suburban traffic, and rapid population growth likely contribute to this pattern. And as commuter traffic continues to expand, these risks are likely to persist into 2026.
- Austin sees high rates of speeding but less aggressive driving.
- Austin drivers are about 20% more likely to be involved in a collision than Nashville drivers.
- However, Austin sees lower levels of aggressive secondary risky behaviors, such as close following and unsafe lane changes.
“What’s interesting is how differently speed shows up across cities,” Woodrow said. “In places like Austin, speed is a key risk, but it’s less often paired with aggressive maneuvering — likely reflecting wider roads and commuter-driven traffic rather than dense, high-pressure driving environments.”
- San Francisco shows a very different risk pattern tied to dense urban driving.
- Of the three cities, San Francisco has the highest collision rate, but most collisions occur at low speeds — averaging under 5 mph, compared to more than 20 mph in Austin and Nashville.
- Drivers in San Francisco are 25% more likely to be involved in a collision than those in Austin.
- Stop sign violations rank as San Francisco’s second most common risky behavior, occurring 3.5 times more often than in Nashville, reflecting the city’s dense grid, steep hills, and frequent stop-and-go routes.
- Cell phone use also ranks higher in San Francisco than in Austin or Nashville, likely driven by congestion and slow-moving traffic.
“What the data keeps reinforcing is that risk doesn’t distribute evenly,” said Woodrow. “It clusters — by geography, by job type, and by operating environment — which is why generic safety programs consistently underperform.”
What to watch for in 2026
Some risks — such as speeding and distracted driving — are universal. Others are clearly shaped by local conditions. Understanding these city-specific patterns helps organizations tailor safety strategies to how and where their drivers actually operate, rather than relying on one-size-fits-all approaches.
Smoking and cell phone distractions increase risk
Cell phone use remains one of the strongest predictors of collisions, and in 2025, it followed a very clear daily pattern. Violations rise sharply just after sunrise. They level off during business hours, then spike again between 4 p.m. and 6 p.m. Notably, it’s the same window when drowsiness sets in, traffic intensifies, and delivery volume peaks. After 7 p.m., cell phone use declines rapidly, and overnight activity falls 80% to 90% from peak levels.
“The late-afternoon window is especially dangerous because multiple risks collide at once,” noted Woodrow. “Drivers are tired, traffic is heavier, and delivery pressure is at its peak. In that environment, even small distractions — like checking a phone — become much harder to avoid and far more likely to lead to a collision.”
Smoking while driving is a less-recognized yet persistent source of distraction. Last year, Motive detected more than 1.3 million smoking events, averaging nearly 3,800 incidents per day. While it often receives less attention than cell phone use, smoking creates similar risks — taking hands off the wheel, eyes off the road, and attention away from driving. When it occurs alongside behaviors such as speeding or close following, the risk increases significantly.
What to watch for in 2026
Distracted driving remains one of the strongest predictors of an incident occurring. Cell phone use and smoking tend to peak late in the day, right when drivers are tired, traffic is heavier, and the pressure to finish deliveries is highest. In those moments, even a quick glance at a phone or taking a hand off the wheel can be enough to cause a collision. AI-powered systems can help spot these early and intervene in real time, giving organizations a critical window to correct risky behavior before drowsiness and congestion result in a collision.
Shorter days, stormy weather, and heavier traffic make fall and winter the most dangerous seasons for collisions
Collision rates climb steadily through the fall. As daylight fades, weather becomes more unpredictable, and traffic volumes increase ahead of the holidays, risk builds week by week. Looking at data through December 30, collision rates peaked in November, continuing a pattern seen in prior years.
In October and November, collision rates were nearly 40% higher than in July. Shorter days, rapidly changing weather, and heavier commercial and consumer activity all increase exposure and make driving conditions more dangerous — especially after the clocks change and evening commutes happen in darkness.
Winter driving is dangerous but for different reasons
Winter doesn’t produce the most collisions, but it does see the riskiest driving behaviors. Winter intensifies risk by changing how people drive, even if total collisions dip in January due to lower traffic volumes.
From December through February, many high-risk behaviors rise 20% or more compared to the rest of the year. Snow, rain, and ice reduce traction and visibility, while early sunsets, cold weather, and long shifts increase drowsy driving.
Winter also changes driver behavior. Drivers have less visibility due to poor weather conditions, roads become slick, and risky behaviors increase across industries, even when fewer vehicles are on the road.
These shifts are especially clear in sectors that operate through severe weather and long hours. For example:
- Seat belt violations surged 150% in passenger transit and 148% in oil and gas from December through February compared to March through November. Spikes in seat belt violations can be a sign of operational stress, so our data suggests these drivers are experiencing tough operating conditions.
- Speeding increased sharply, with transportation and logistics seeing a 30% jump during this same period — a dangerous combination when roads are hazardous.
What to watch for in 2026
Seasonal and weather-related collision risk isn’t going away. As organizations continue operating through winter months, success will depend on spotting risk earlier — before a collision occurs. Monitoring near-collisions, drowsiness indicators, speeding, and aggressive driving behaviors becomes especially critical as road and environmental conditions change quickly.“
Weather conditions play a huge part in our emergency response,” said Nick Oney, fleet director at Xylem Kendall. “When we are on our way to a storm, typically there’s inclement weather and you need to account for that. So with that weather overlay from Motive we’re able to see where our drivers are at, we’re able to see how it relates to weather conditions.”
Collision rates vary sharply by industry due to different operating environments
Not all driving environments are created equal, and our data makes that clear. Our data suggests collision risk isn’t driven by mileage alone — it’s shaped by where and how work gets done.
“Collision risk is shaped as much by the work drivers do as by how they drive,” said Woodrow. “Route types, operating environments, and daily job demands create fundamentally different risk profiles across industries.”
When we examined collision rates across the industries we serve — including transportation and logistics, waste and recycling, field services, utilities, construction, and oil and gas — clear differences emerged. Industries such as waste and recycling, field services, utilities, construction, and oil and gas had the highest collision rates per million miles.
These industries operate in complex, constantly changing environments — urban streets, residential neighborhoods, job sites, and mixed-traffic routes — where stop-and-go driving, tight spaces, and unpredictable conditions make risk harder to control.
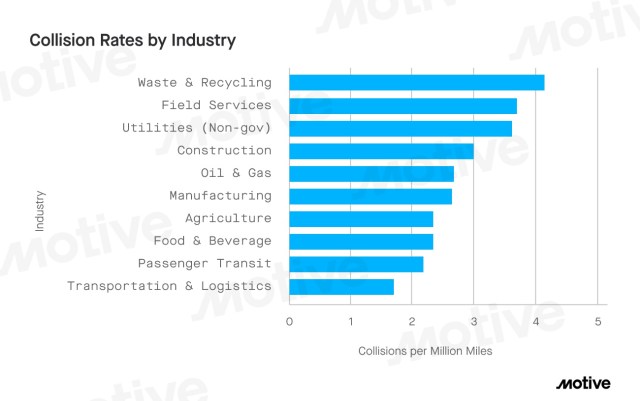
- From June to November 2025, waste and recycling had the highest collision rate, with just over four collisions for every million miles driven — reflecting constant stop-and-go driving in dense urban neighborhoods.
- Field services and utilities weren’t far behind, each seeing nearly four collisions per million miles.
- At the other end of the spectrum, transportation and logistics fleets had the lowest collision rate, with fewer than two collisions per million miles, despite logging far more miles than any other industry.
- Overall, that’s roughly a 2.4x gap between the riskiest and safest industries.
“Operating environment plays a huge role in collision risk,” said Woodrow. “Industries working in dense urban settings — like waste and recycling, field services, and construction — face constant stop-and-go traffic and complex conditions, which drives higher collision rates. Many of these incidents happen at low speeds, so without camera visibility, they’re often missed by headquarters.”
“Transportation and logistics fleets, by contrast, tend to operate on interstates, where environments are simpler and collision rates are lower,” Woodrow added. “That said, when collisions do happen, they’re often more severe due to vehicle size and speed.”
“What’s changing now is benchmarking,” he said. “With AI and dash cam technology, organizations with fleets can capture every incident — not just the most severe ones — and finally compare risk across industries in a meaningful way.”
How behavior patterns reinforce industry risk
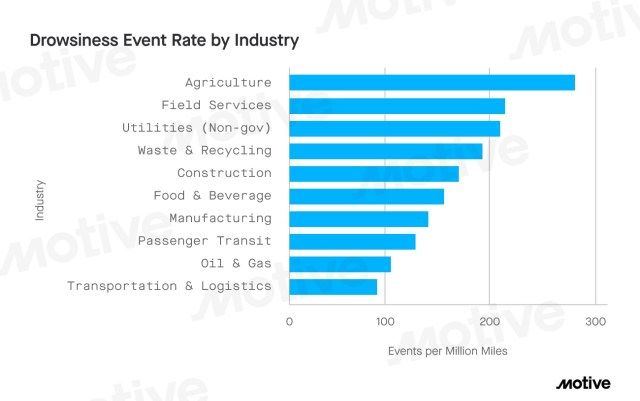
- Across industries, the pre-dawn hours from 5 a.m. – 7 a.m. is a critical drowsiness window, when visibility is low and many field-heavy industries begin their day.
- Early-start industries, including agriculture, construction, and food and beverage, see drowsiness peak as early as 5 a.m., reflecting pre-dawn starts and long shifts.
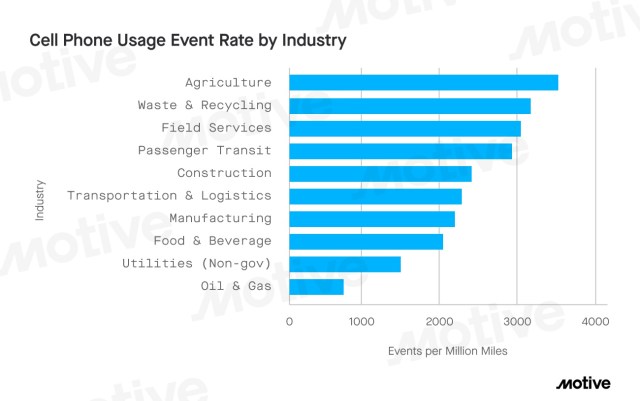
- Cell phone use peaks in the late afternoon (4 p.m. – 6 p.m.) across nearly every industry, which overlaps with drowsiness, heavy traffic, and delivery cutoffs, service completion targets, and shift wrap-up pressure— a high-risk combination.
- Agriculture shows the most extreme rates, reaching the highest at 4 p.m.
- Waste and recycling follows a different rhythm, with cell phone use spiking at 7 p.m. and drowsiness peaking at midnight, reflecting early-morning collection routes and overnight operations.
- Meanwhile, transportation & logistics — the industry with the lowest-collisions — operates on more predictable highway routes, with smoother traffic flow and greater separation from pedestrians and dense urban environments.
Their cell phone and drowsiness peaks are smaller and more spread out, aligning more closely with standard business-hour drowsiness. These sectors benefit from more highway-weighted driving, longer routes, and fewer stop-and-go conditions.
Additionally these industries typically employ professional drivers, enforce tighter driving regulations, and maintain higher dashcam adoption, all of which contribute to lower overall risk.
“We’re already seeing significant improvements in keeping our drivers safe and prepared,” said Daniel Patterson, director of safety at Western Express. “Motive AI features bring our ability to alert unsafe conditions and proactively coach to a new level, keeping our drivers safer and our liability lower.”
Taken together, these behavior patterns closely mirror collision outcomes. Industries with the most extreme spikes in drowsiness and distraction also see the highest collision rates — underscoring how work schedules and operating environments shape risk as much as driving behavior itself.
What to watch for in 2026
Industry-level differences aren’t going away — if anything, the divide is likely to widen. Industries operating in dense, weather-exposed, or time-sensitive environments will face persistent pressures, especially during early mornings, late afternoons, and winter months when distraction and drowsiness peak.
Organizations with more stable operating conditions will maintain lower collision rates, but only if they continue to control speeding, distraction, and drowsiness.
The takeaway is simple: risk isn’t the same everywhere, and understanding behavior helps prevent collisions.
2025 tariff policies didn’t significantly impact collision rates
Trade policy shifts reshaped freight flows in 2025, but they didn’t necessarily lead to more collisions in the U.S.-Mexico border crossings.
Despite increased activity at major ports like Laredo, Motive data shows that collision rates at these locations remained largely stable. In other words, more vehicles at the border didn’t automatically translate into more collisions. Instead, risk appears to be shifting in more nuanced ways than traffic growth alone.
Mexico trade stayed strong as global flows shifted
Based on our data, tariff uncertainty drove sharper month-to-month swings in imports in 2025. While trade volumes from China softened, Mexico remained resilient. U.S. imports from Mexico grew 6.5% year over year, slightly above early-2024 growth, and accelerated to 8.2% by July, reinforcing Mexico’s role as a critical U.S. trade partner.
As a result, more freight moved through border crossings, inland ports, and major Southwest corridors. That increase raised congestion and drowsiness exposure, even as collision rates at the border stayed flat.
Trade surges pushed risk inland, not at the border
In early April, our data reveals the Port of Laredo saw a 46% year-over-year surge in trade activity, and border vehicle traffic remained about 32% higher, year over year. The surge was especially noticeable throughout the spring, as companies moved inventory ahead of potential tariff changes.
Spring collision rates near Laredo didn’t rise as trade activity increased. Instead, sustained volume shifted pressure inland, along corridors like I-35, I-10, and I-69, where overnight and early-morning driving increased and drowsiness became a bigger factor.
The data suggests that tariff-driven surges don’t necessarily concentrate risk at border crossings. Instead, they often push risk farther into the supply chain, changing when and where safety challenges show up.
What to watch for in 2026
If trade and tariff volatility continues into 2026, freight patterns are likely to remain less predictable. Collision and near-collision risk may continue shifting inland. When freight moves inland away from ports, tired drivers face longer hauls. Policy changes can also create short-term pressure around major trade deadlines.
“Geopolitical disruption doesn’t show up as a sudden spike in collisions,” said Woodrow. “It shows up as subtle operational shifts — freight moving through new corridors, more overnight driving, longer hauls, and higher drowsiness exposure. That’s where trade dynamics ultimately intersect with road safety.”
Ongoing U.S.-Venezuela tensions are already complicating trade flows, with sanctions enforcement, shipping constraints, and political uncertainty affecting energy markets and carrier routing. Data tracking shows the number of Venezuelan crude exports have slowed sharply, forcing shifts in maritime activity and supply chains.
“That kind of volatility doesn’t instantly raise collision counts,” Woodrow added. “But it reshapes freight patterns in ways that increase exposure — especially during overnight hours and along unfamiliar routes. That’s where risk tends to emerge.”
For safety and operations teams, the takeaway is clear: Understanding where risk moves — not just where freight volumes increase — will be critical in the year ahead.