


Fleet leaders have more data than ever — from telematics and maintenance logs to fuel, safety, and spend. Without the right analytics, that data stays trapped in silos across spreadsheets and static reports that are hard to act on.
Fleet management analytics brings it together in a single, clear view of how your organization is performing so you can move faster, control costs, and reduce risk.
In this guide, we’ll break down what fleet management analytics is, why it matters now, the metrics that matter most, and what to look for in an analytics solution.To go deeper on the data foundation behind analytics, see our guide to fleet data management and reporting.
What is fleet management analytics?
Fleet management analytics is the practice of turning operational data from your vehicles, drivers, and back office into insights you can use to run a safer, more efficient, and more profitable fleet.
Modern analytics platforms bring together:
- Telematics data (location, utilization, idle time, speed)
- Safety data (AI dash cam events, collisions, risky behaviors)
- Maintenance data (PMs, fault codes, repair history)
- Fuel and spend data (fuel card transactions, cost per mile, fraud)
- Compliance data (HOS, DVIRs, inspections)
- Workforce data (routes, jobs, time-on-task)
Instead of toggling between tools or exporting CSVs, fleet management analytics gives you one place to see trends, compare performance, and answer “why is this happening?” — not just “what happened?”
Why does fleet management analytics matter now?
Organizations are operating fleets in tougher environments than ever as costs are rising, regulations are stricter, and customers expect faster, more reliable service. Analytics turns day‑to‑day operational data into early warning signals and clear priorities, so you can stay ahead of problems instead of reacting to them.
1. Costs are rising and margins are tight
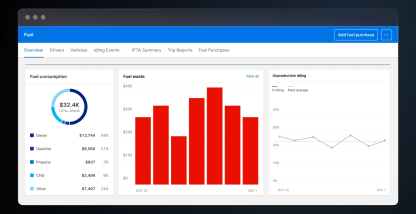
Fuel, maintenance, insurance, and labor costs are all under pressure. Analytics helps you:
- Find out where money is actually going.
- See which assets, lanes, or regions are driving costs up.
- Prioritize the actions that make the biggest financial impact.
2. Data is fragmented across tools and teams
Most fleets run multiple systems for safety, telematics, maintenance, and spend. Without analytics, it’s hard to:
- See the full story behind an issue (e.g., a high-cost vehicle or region).
- Connect driver behavior to fuel, maintenance, and claims.
- Share a consistent picture with operations, safety, and finance.
Analytics unifies these views so everyone is working from the same numbers.
3. Leaders need answers, not more reports
Executives and frontline managers don’t have time to build complex queries. Fleet management analytics makes it easier to:
- Get to the answer faster (e.g., “Which depots have the highest idle time?”).
- Move from lagging, month-end views to near real-time visibility.
- Turn recurring questions into reusable dashboards and reports.
What data feeds into fleet management analytics?
A strong fleet analytics program pulls from multiple sources:
- Vehicle telematics → GPS, engine hours, mileage, idle time, speed bands
- Safety & video → AI dash cam events, collisions, near-misses, safety scores
- Maintenance → PM schedules, fault codes, repair orders, downtime
- Fuel & spend → Fuel card usage, price per gallon, spend by vehicle/driver/location
- Compliance → HOS violations, DVIR defects, inspection outcomes
- Operations & jobs → On‑time performance, stops per route, dwell time, service time
The value comes from connecting these data streams — for example:
- Linking high idle time to fuel spend and driver behavior
- Tying frequent breakdowns to missed preventive maintenance (PMs) and utilization
- Connecting safety events to insurance costs and claims
Key fleet management analytics metrics (and what they tell you)
Below are core metrics many fleets track, plus what each one helps you understand.
| Metric | What it tells you | Example action |
| Cost per mile / per job | True cost to move a load or complete a job | Re‑price contracts or rebalance lanes/routes |
| Fuel cost per mile | Fuel efficiency by vehicle, lane, or region | Target high-cost routes and aggressive driving |
| Vehicle utilization % | How often assets are actually used vs. available | Reassign or retire consistently underused assets |
| Idle time % of engine hours | How much time is spent burning fuel while stationary | Launch idle-reduction coaching and policies |
| Safety events per 10,000 miles | Frequency of risky behavior or incidents | Focus coaching and policy changes where risk is highest |
| Unplanned downtime hours | How often vehicles are sidelined unexpectedly | Tighten PM program and investigate root causes |
| On‑time delivery / completion rate | Reliability of service performance | Adjust routing, staffing, or scheduling practices |
Over time, these metrics help you benchmark performance, set targets, and track whether your safety, maintenance, or fuel initiatives are actually working.
What kinds of questions can fleet management analytics answer?
When your data is centralized and searchable, you can quickly answer questions like:
- Cost and efficiency
- Which regions or depots have the highest cost per mile?
- Which vehicles are our most expensive to run, and why?
- Where are we seeing persistent fuel waste?
- Safety and risk
- Which drivers or routes generate the most safety events?
- Are certain customers, locations, or shifts linked to higher incident rates?
- Maintenance and uptime
- Which assets have the most unplanned downtime?
- How do PM compliance rates affect breakdowns and repair spend?
- Utilization and planning
- Do we have assets that are consistently underutilized?
- Are we short on equipment in certain markets while over-capacity in others?
Answering these questions quickly is the difference between reacting to problems and getting in front of them.
How to build a fleet management analytics strategy
1. Define your goals and audience
Start with the outcomes, not the charts. For example:
- Cut fuel cost per mile by 5–10%.
- Reduce preventable collisions by a set percentage.
- Lower unplanned downtime by a certain number of hours/month.
Then, identify who needs which insights (operations, safety, maintenance, finance, executives).
2. Centralize your data
Work toward one platform (or tightly integrated stack) that brings together:
- Telematics and location data
- Safety and AI dash cam events
- Maintenance and downtime
- Fuel, card, and other fleet-related spend
The less time you spend exporting and reconciling, the more time you have for analysis and action.
3. Choose your KPIs and reporting cadence
Pick a manageable set of KPIs for each audience, such as:
- Operations: utilization, cost per mile, on‑time performance
- Safety: events per 10,000 miles, safety scores, collisions
- Maintenance: PM compliance, fault-code trends, downtime
- Finance: total fleet cost, fuel & maintenance spend, ROI of initiatives
Decide what’s daily, weekly, monthly, and what only needs a deeper quarterly look.
4. Make analytics self‑serve
The more your teams can answer their own questions, the faster they move. Look for:
- Role-based dashboards (safety, ops, maintenance, finance)
- Filters by region, asset class, customer, or driver
- AI and natural language search (e.g., “show top 10 vehicles by downtime last quarter”)
5. Close the loop: from insight to action
Analytics only matters if it changes behavior. Build simple playbooks like:
- “If idle time > X% → trigger coaching + policy reminder”
- “If unplanned downtime crosses threshold → review PM schedule + vendor performance”
- “If safety events spike on a lane → audit routing, speeds, and customer SLAs”
Tie your analytics back to coaching programs, PM workflows, fuel initiatives, and budget decisions.
What to look for in a fleet management analytics platform
When you evaluate solutions, focus on whether they can:
- Unify data sources
- Connect telematics, safety, maintenance, and spend in one place
- Support custom dashboards & reports
- Build views for different teams without heavy IT support
- Handle large, complex fleets
- Perform well across thousands of vehicles, drivers, and trips
- Offer AI-assisted exploration
- Use natural language queries (e.g., “Which branches have the highest fuel cost per mile?”) instead of complex SQL or pivot tables
- Make sharing easy
- Export or share live dashboards with leadership, branches, and partners
- Respect your data boundaries
- Role-based access, permissions, and strong security controls
How Motive supports fleet management analytics
Motive’s capabilities are built to help fleets move from static reports to live, flexible fleet management analytics.
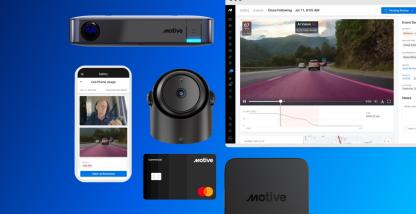
With Motive Analytics and the Motive Integrated Operations Platform, fleets can:
- Combine telematics, safety, maintenance, and spend data into a unified view.
- Build custom dashboards for operations, safety, maintenance, and finance.
- Use AI and natural language to ask questions and generate reports in seconds.
- Track key metrics like cost per mile, utilization, safety performance, and downtime.
- Share insights across teams so everyone is working from the same numbers.
Instead of wrestling with exports and one-off spreadsheets, your teams get a single source of truth for how the fleet is performing — and where to focus next.
Turning fleet data into a competitive advantage
Fleet management analytics isn’t about staring at more dashboards. It’s about:
- Seeing the patterns behind your biggest costs and risks.
- Prioritizing the levers that will drive significant improvements.
- Giving every team — from dispatch to finance — the clarity to act quickly.
If you’re ready to move beyond fragmented reports and make your data work harder for you, start by centralizing your fleet data, defining a small set of high-impact KPIs, and choosing an analytics platform that can grow with your operation.
To see how an AI-powered analytics solution can help your team move from data to decision faster, explore the Motive Analytics page or dive into the Guide to AI in Fleet Management.